Documentation
Table of Contents
Architecture Overview
KubeFleet consists of three main components that work together to provide comprehensive Kubernetes monitoring with real-time log streaming:
Kubernetes Agent
Runs inside your Kubernetes cluster, collecting data about namespaces, pods, deployments, metrics, and pod logs with automatic level detection.
Dashboard Server
Go backend that receives data via gRPC, serves the React frontend via HTTP APIs, and provides real-time log streaming capabilities.
React Frontend
Modern web interface built with TypeScript and Material-UI for data visualization and comprehensive log monitoring with filtering and search.
Data Flow
Kubernetes Cluster → Agent → gRPC → Dashboard Server → HTTP → React Frontend
                                    ↓
                              Log Collection & Streaming
Dashboard Interface
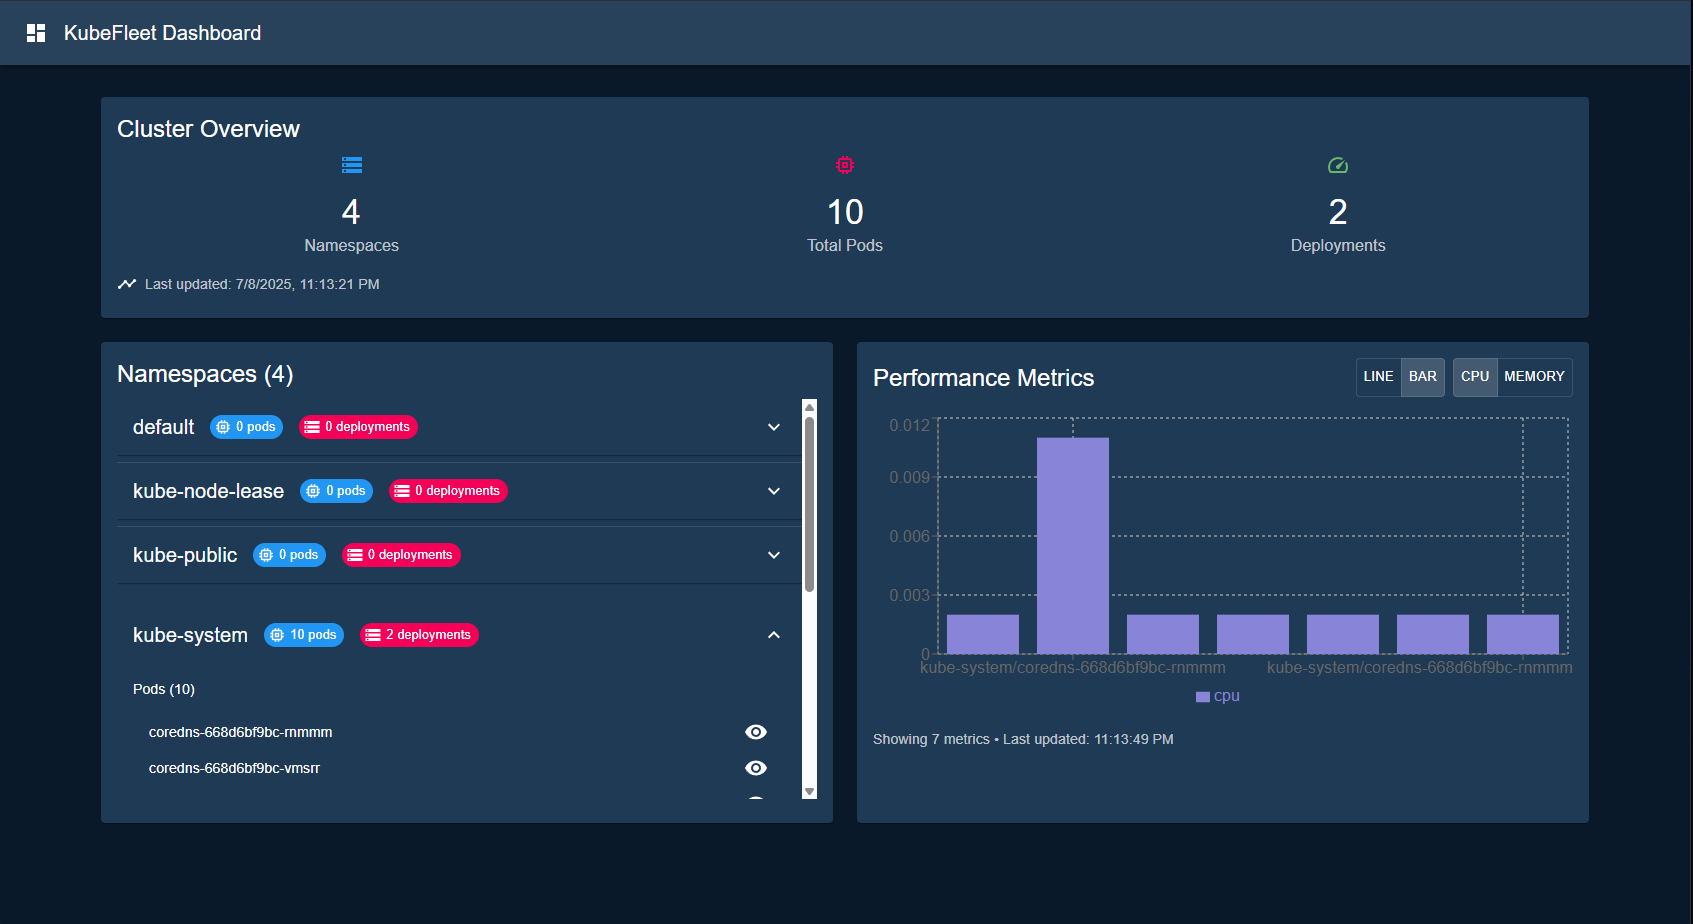
The main dashboard provides real-time cluster monitoring with namespace exploration and metrics visualization
Features
Core Monitoring
- Smart Discovery: Automatically discovers all namespaces and resources
- Resource Monitoring: Tracks pods, deployments, and services in real-time
- Performance Metrics: Collects CPU and memory usage data
- Real-time Updates: Live data refresh every 30 seconds
Log Monitoring
- Real-time Log Streaming: Live pod log updates every 5 seconds
- Multi-container Support: View logs from all containers in a pod
- Log Level Detection: Automatic parsing of ERROR, WARN, INFO, DEBUG levels
- Advanced Filtering: Filter by log level and search for specific text
- Log Download: Export filtered logs as text files
- Auto-scroll: Automatically scroll to latest logs
- Color-coded Levels: Visual distinction for different log levels
User Interface
- Cluster Overview: High-level statistics and resource counts
- Namespace Explorer: Interactive drill-down into namespaces and resources
- Performance Charts: Beautiful, interactive charts for metrics visualization
- Log Viewer Modal: Full-featured log viewing with filtering and search
- Modern UI: Dark theme with Material-UI components
- Responsive Design: Works perfectly on desktop and mobile
API Reference
HTTP API Endpoints
GET /api/data
Get all historical data points
{
  "data": [
    {
      "resources": [...],
      "metrics": [...],
      "logs": [...],
      "timestamp": 1640995200
    }
  ],
  "count": 10
}
GET /api/data/latest
Get the most recent data point
{
  "data": {
    "resources": [...],
    "metrics": [...],
    "logs": [...],
    "timestamp": 1640995200
  }
}
GET /api/logs
Get all logs from latest data
{
  "logs": [
    {
      "namespace": "default",
      "pod_name": "example-pod",
      "container_name": "main",
      "log_line": "INFO: Application started",
      "timestamp": 1640995200,
      "level": "INFO"
    }
  ]
}
GET /api/logs/{namespace}/{pod}
Get logs for a specific pod
{
  "logs": [
    {
      "namespace": "default",
      "pod_name": "example-pod",
      "container_name": "main",
      "log_line": "INFO: Application started",
      "timestamp": 1640995200,
      "level": "INFO"
    }
  ]
}
GET /api/logs/{namespace}/{pod}/{container}
Get logs for a specific container
{
  "logs": [
    {
      "namespace": "default",
      "pod_name": "example-pod",
      "container_name": "main",
      "log_line": "INFO: Application started",
      "timestamp": 1640995200,
      "level": "INFO"
    }
  ]
}
GET /api/health
Health check endpoint
{
  "status": "healthy",
  "dataPoints": 10
}
gRPC Service
AgentReporter Service
service AgentReporter {
  rpc ReportData(AgentData) returns (ReportResponse);
  rpc StreamPodLogs(LogRequest) returns (stream LogStream);
}

message AgentData {
  repeated ResourceInfo resources = 1;
  repeated ResourceMetrics metrics = 2;
  repeated PodLog logs = 3;
  int64 timestamp = 4;
}

message PodLog {
  string namespace = 1;
  string pod_name = 2;
  string container_name = 3;
  string log_line = 4;
  int64 timestamp = 5;
  string level = 6; // INFO, ERROR, WARN, DEBUG
}

message LogRequest {
  string namespace = 1;
  string pod_name = 2;
  string container_name = 3; // Optional, if empty gets all containers
  int32 tail_lines = 4; // Number of lines to fetch, default 100
  bool follow = 5; // Whether to follow logs in real-time
}

message LogStream {
  repeated PodLog logs = 1;
  bool is_complete = 2;
}
Configuration
Environment Variables
| Variable | Description | Default |
|---|---|---|
| KUBEFLEET_SERVER_ADDR | gRPC server address | localhost:50051 |
| HTTP_PORT | HTTP server port | 3000 |
| GRPC_PORT | gRPC server port | 50051 |
Kubernetes RBAC
The agent requires the following permissions:
apiVersion: rbac.authorization.k8s.io/v1
kind: ClusterRole
metadata:
  name: kubefleet-agent
rules:
- apiGroups: [""]
  resources: ["namespaces", "pods", "services"]
  verbs: ["get", "list"]
- apiGroups: ["apps"]
  resources: ["deployments"]
  verbs: ["get", "list"]
- apiGroups: ["metrics.k8s.io"]
  resources: ["pods", "nodes"]
  verbs: ["get", "list"]
Deployment
Docker Images
Agent Image
docker build -t kubefleet-agent:latest .Dashboard Image
docker build -f Dockerfile.dashboard -t kubefleet-dashboard:latest .Kubernetes Deployment
Deploy using the provided manifests:
# Deploy dashboard
kubectl apply -f deploy/dashboard-deployment.yaml

# Deploy agent
kubectl apply -f deploy/agent-deployment.yaml

# Check status
kubectl get pods -l app=kubefleet-dashboard
kubectl get pods -l app=kubefleet-agent
Service Configuration
The dashboard service exposes:
- Port 3000: HTTP dashboard interface
- Port 50051: gRPC API for agent communication
Monitoring & Logging
Health Checks
Both components include health check endpoints:
# Dashboard health check
curl http://localhost:3000/api/health

# Expected response
{
  "status": "healthy",
  "dataPoints": 10
}
Logging
Components log to stdout/stderr for Kubernetes log collection:
# View dashboard logs
kubectl logs -l app=kubefleet-dashboard

# View agent logs
kubectl logs -l app=kubefleet-agent
Metrics
The dashboard collects and displays:
- Namespace and resource counts
- Pod and deployment metrics
- CPU and memory usage
- Historical data trends
- Real-time pod logs with level detection
Log Monitoring Features
The log viewer provides:
- Real-time log streaming with 5-second refresh intervals
- Multi-container log viewing with container selection
- Automatic log level detection (ERROR, WARN, INFO, DEBUG)
- Log filtering by level and text search
- Log download functionality for offline analysis
- Auto-scroll to latest logs with toggle control
- Color-coded log levels for visual distinction
Security
Network Security
- gRPC communication between agent and dashboard
- HTTP APIs for frontend communication
- Support for TLS encryption (planned)
- Secure log streaming with proper access controls
Access Control
- Kubernetes RBAC integration
- Principle of least privilege for agent permissions
- Service account-based authentication
- Log access controls based on namespace permissions
Data Protection
- Input validation and sanitization
- Secure error handling
- No sensitive data logging
- Log data retention controls