Modern Kubernetes Monitoring

Intelligent agent + Beautiful dashboard = Complete cluster visibility with real-time logs

Why Choose KubeFleet?

Smart Discovery

Automatically discovers all namespaces and resources in your Kubernetes cluster with intelligent monitoring and real-time updates.

Real-time Metrics & Logs

Beautiful, interactive charts showing CPU, memory, and performance metrics with live updates every 30 seconds. Plus comprehensive log monitoring with filtering and search.

Lightning Fast

Built with Go and gRPC for maximum performance. Deploy in minutes with our Kubernetes manifests and enjoy instant log streaming.

Latest Features

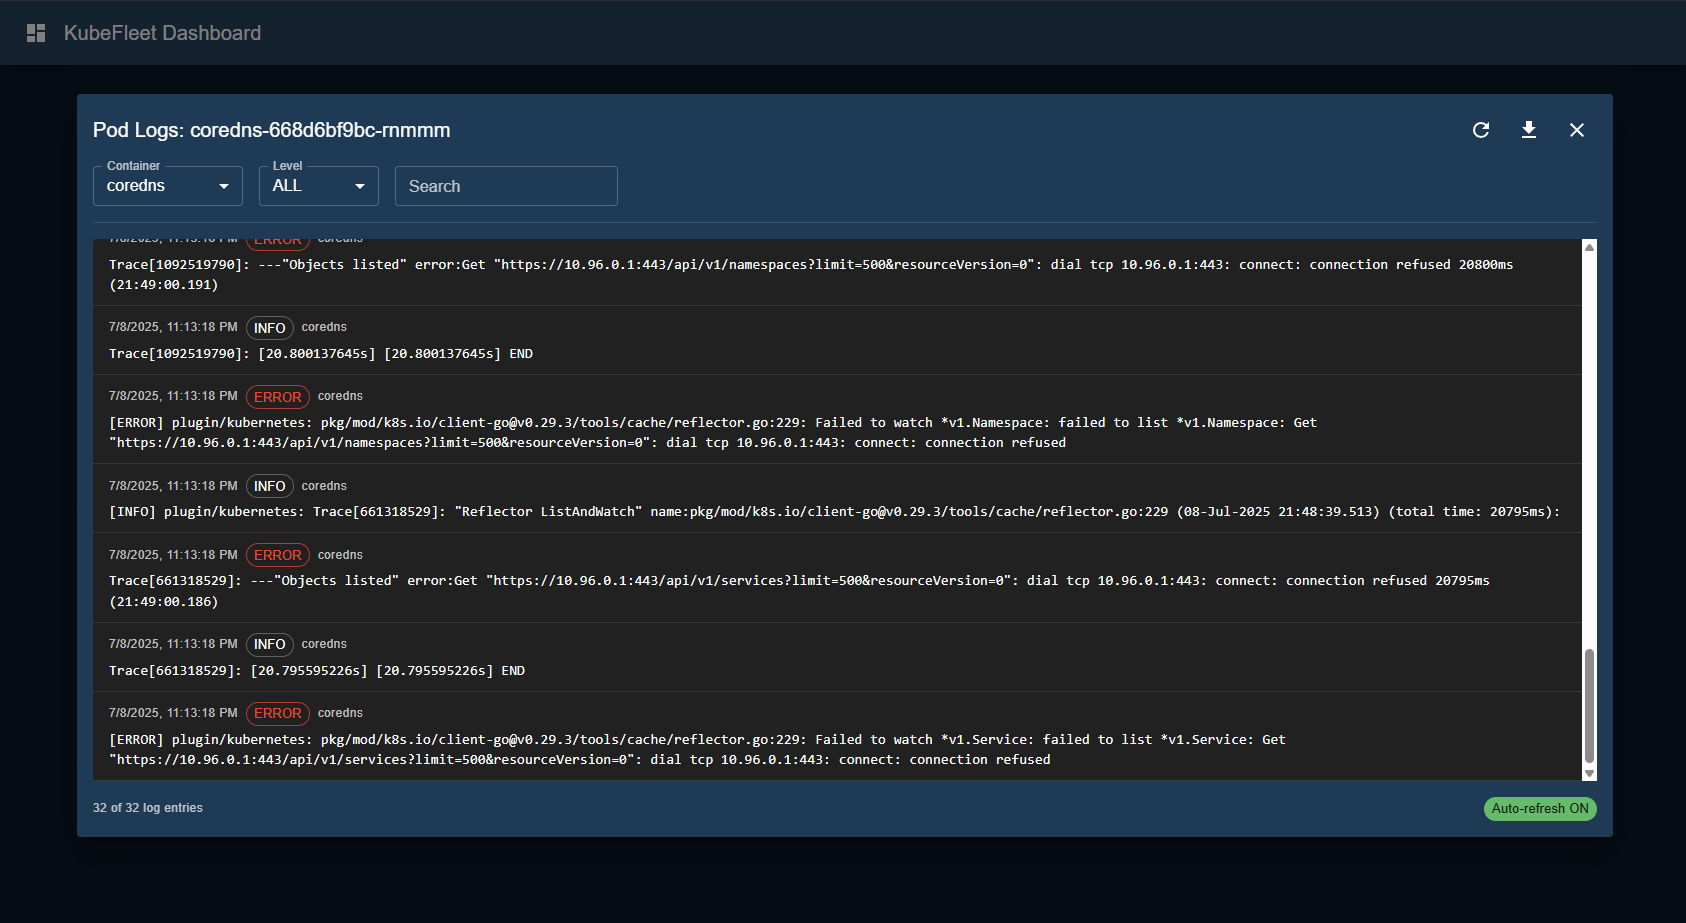
Real-time Log Viewer

Live pod log streaming with automatic level detection, filtering, and search capabilities.

Multi-container Support

View logs from all containers in a pod with easy container selection and switching.

Advanced Filtering

Filter logs by level (ERROR, WARN, INFO, DEBUG) and search for specific text patterns.

Log Export

Download filtered logs as text files for offline analysis and debugging.

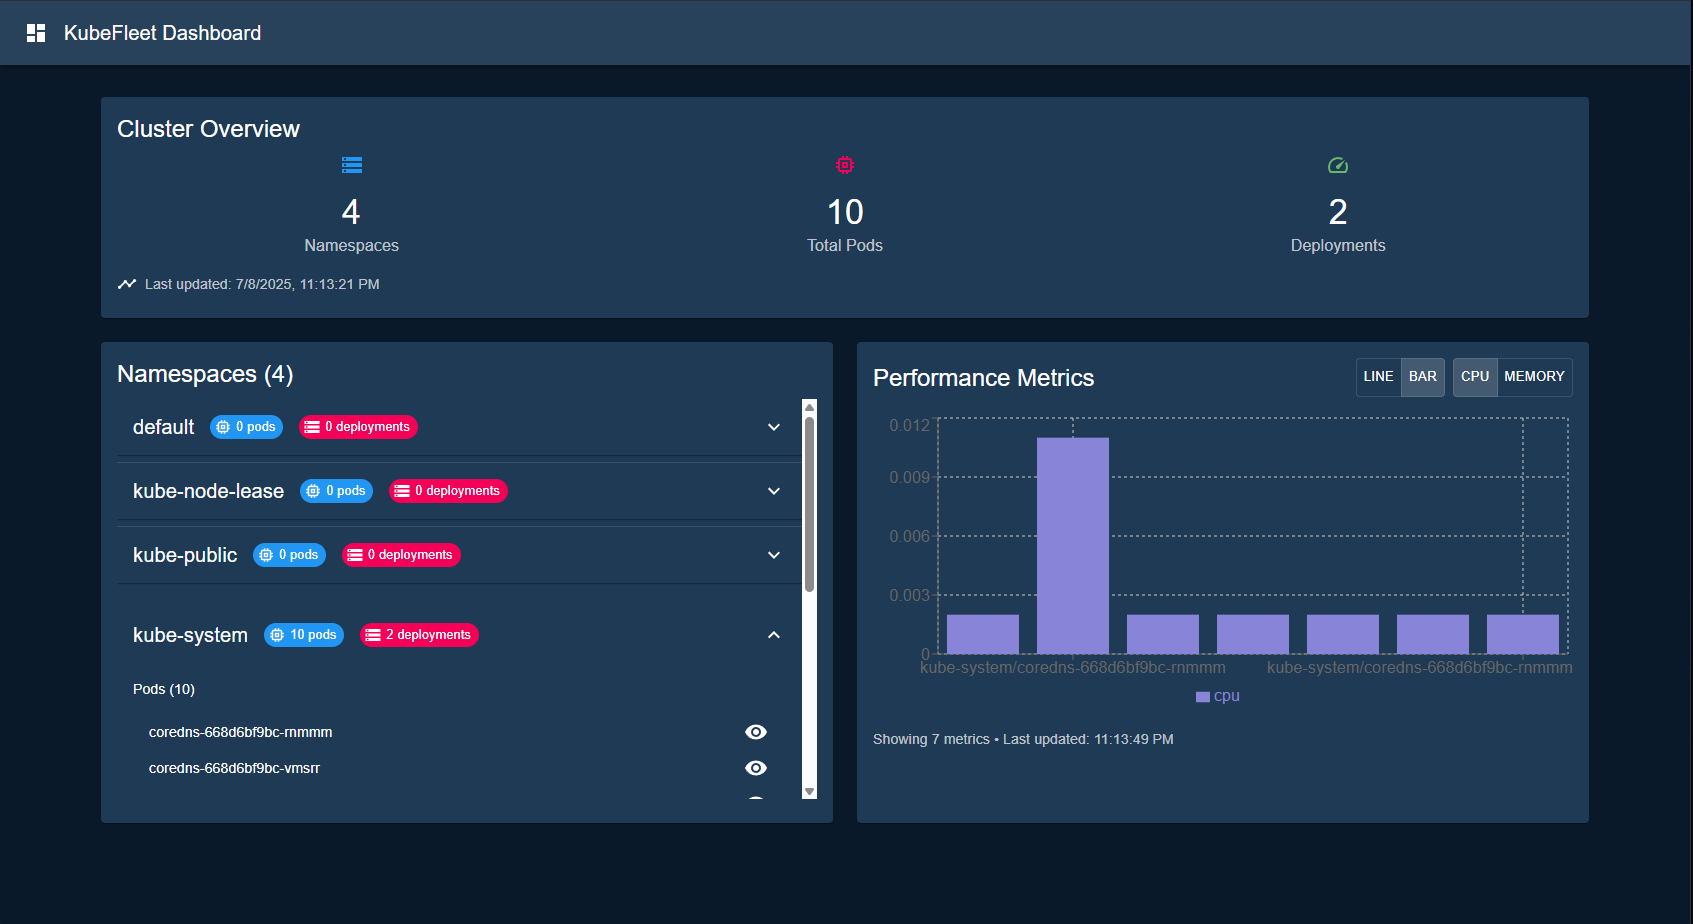
Real-time Log Monitoring

KubeFleet Log Viewer

Advanced log viewer with filtering, search, and real-time updates

Simple Architecture

Kubernetes Agent

Collects cluster data & logs

Dashboard Server

gRPC + HTTP APIs + Log streaming

React Dashboard

Beautiful UI + Log viewer

Dashboard Overview

KubeFleet Dashboard Overview

Real-time cluster monitoring with namespace exploration and metrics visualization

Get Started in Minutes

# Clone the repository
git clone https://github.com/thekubefleet/kubefleet.git
cd kubefleet
# Start the dashboard
go run ./cmd/server
# Start the agent
go run ./cmd/agent
# Open dashboard
open http://localhost:3000